In the Dashboard

Every Upwork proposal, reply, and connect - measured.

Upwork shows you almost nothing about your own performance. The Upwex analytics dashboard fills the gap: it tracks every job you viewed, every proposal you sent, every reply and offer, and every connect you spent - across all your Upwork profiles and your whole team. Manual bids and Auto-Bidding roll into the same numbers. See what is working, fix what is not, and get a recap in your inbox every week.

4.8 on Chrome Web Store Free 20 AI credits No card

Activity Summary

Your whole funnel, in four numbers and a date range.

The dashboard opens with the metrics that matter: Jobs Viewed, Proposals Sent, Replies, and Reply Rate, each with a comparison against the previous period. Below sit the secondary stats - Invites, Offers, Direct Messages, Connects Used, Boost Connects, Avg Connects per Bid, and Cost per Reply - so you see not just how much you bid, but what it cost and what it returned.

Upwex Activity Summary panel - four stat cards (237 Jobs Viewed, 47 Proposals Sent, 5 Replies, 10.64% Reply Rate) with period comparison, above secondary metrics for Invites, Offers, Direct Messages, Connects Used, Boost Connects, Avg Connects per Bid and Cost per Reply

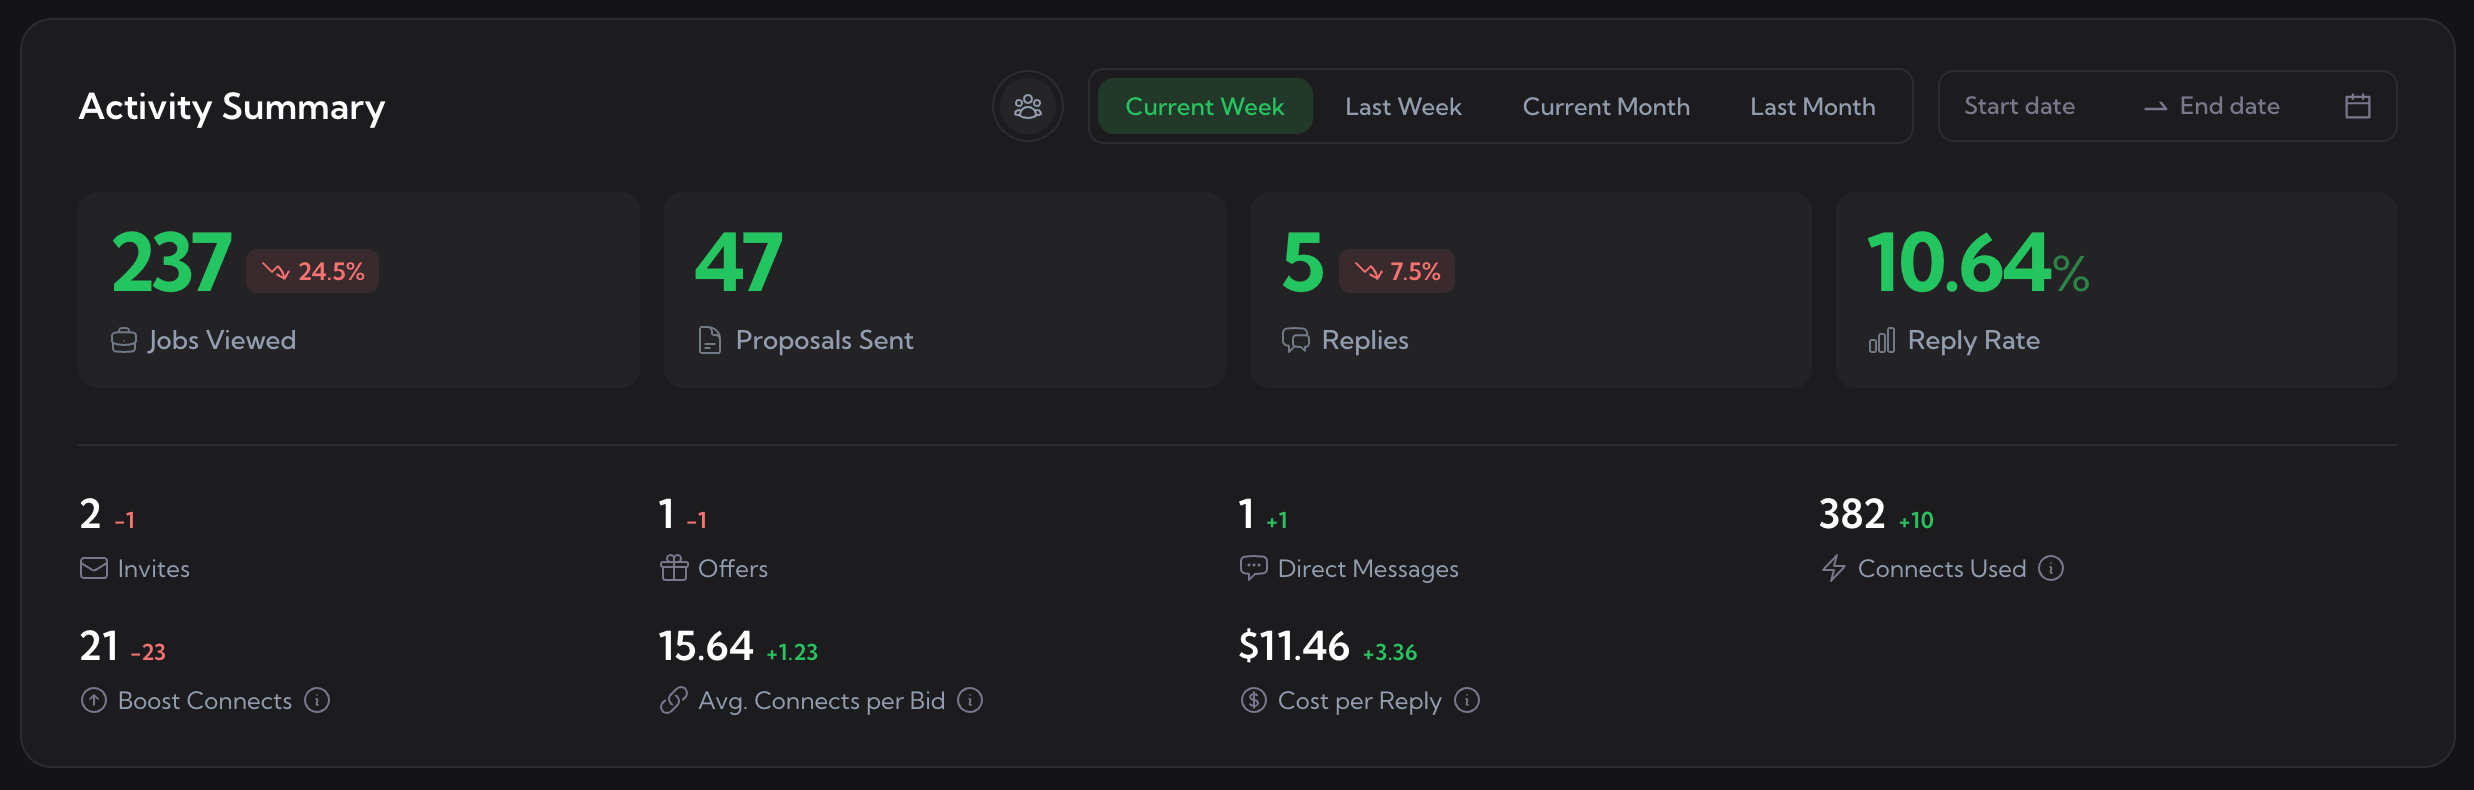
Activity Summary. Period tabs and a date range live at the top; every number carries a comparison against the previous period.

Performance by Profile

Compare every profile and team member side by side.

Run more than one Upwork profile, or a team? The Performance by Profile table breaks proposals, replies, reply rate, invites, DMs, offers, and connects down per person. Reply rate is colour-coded - green above 10%, yellow 5-10%, red below - so the strong and weak profiles are obvious at a glance. A totals row sums the whole operation.

Upwex Performance by Profile table - rows per team member (Oleksii B., Maria K., Daniel R.) with Proposals, Replies, colour-coded Reply %, Invites, DM, Offers and Connects columns, plus a Total row

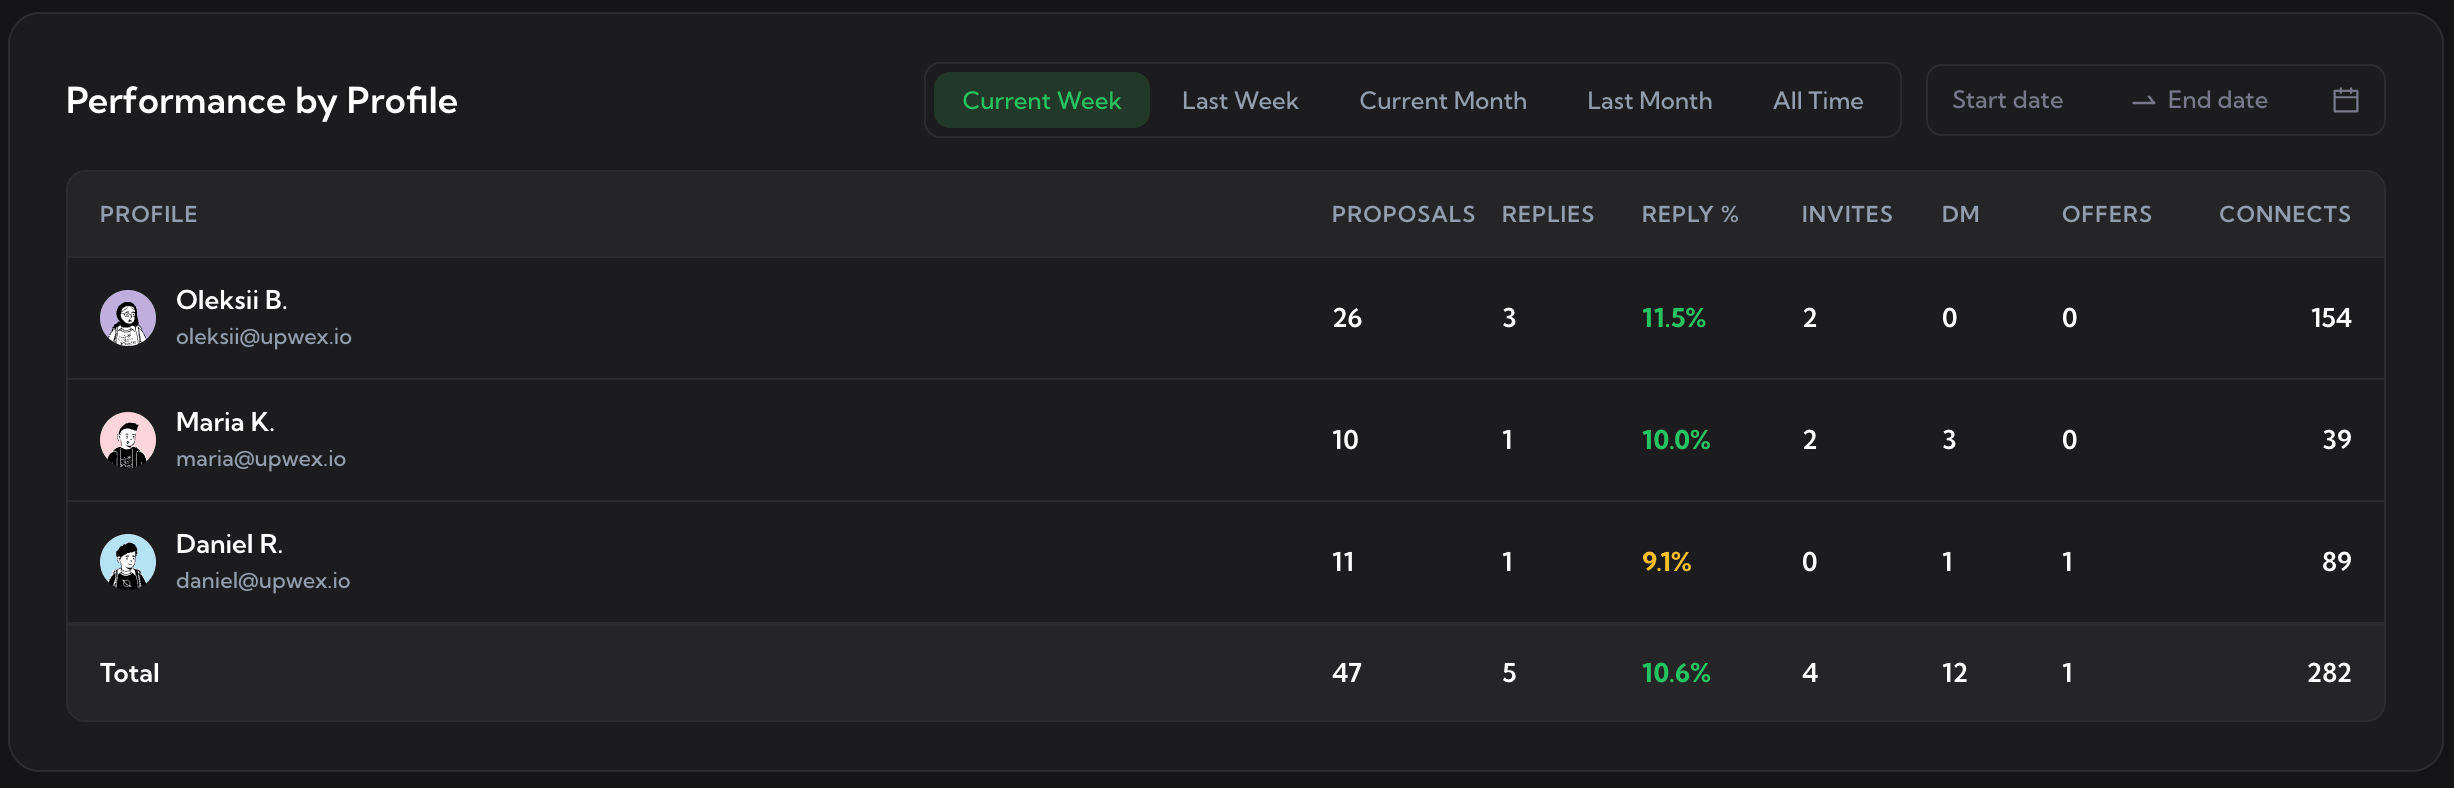
Performance by Profile. Reply rate is colour-coded per row; the totals row sums every profile.

Proposals & Replies

Watch proposals turn into replies, day by day.

The Proposals and Replies chart plots how many proposals you sent and how many came back as replies across your date range, with a reply-rate line over the top. A slow week and a broken week look different - this is how you tell them apart.

Upwex Proposals and Replies chart - purple Proposals bars, blue Replies bars and pink Offers with a green reply-rate line over a 13-day range, tooltip showing the May 1 breakdown

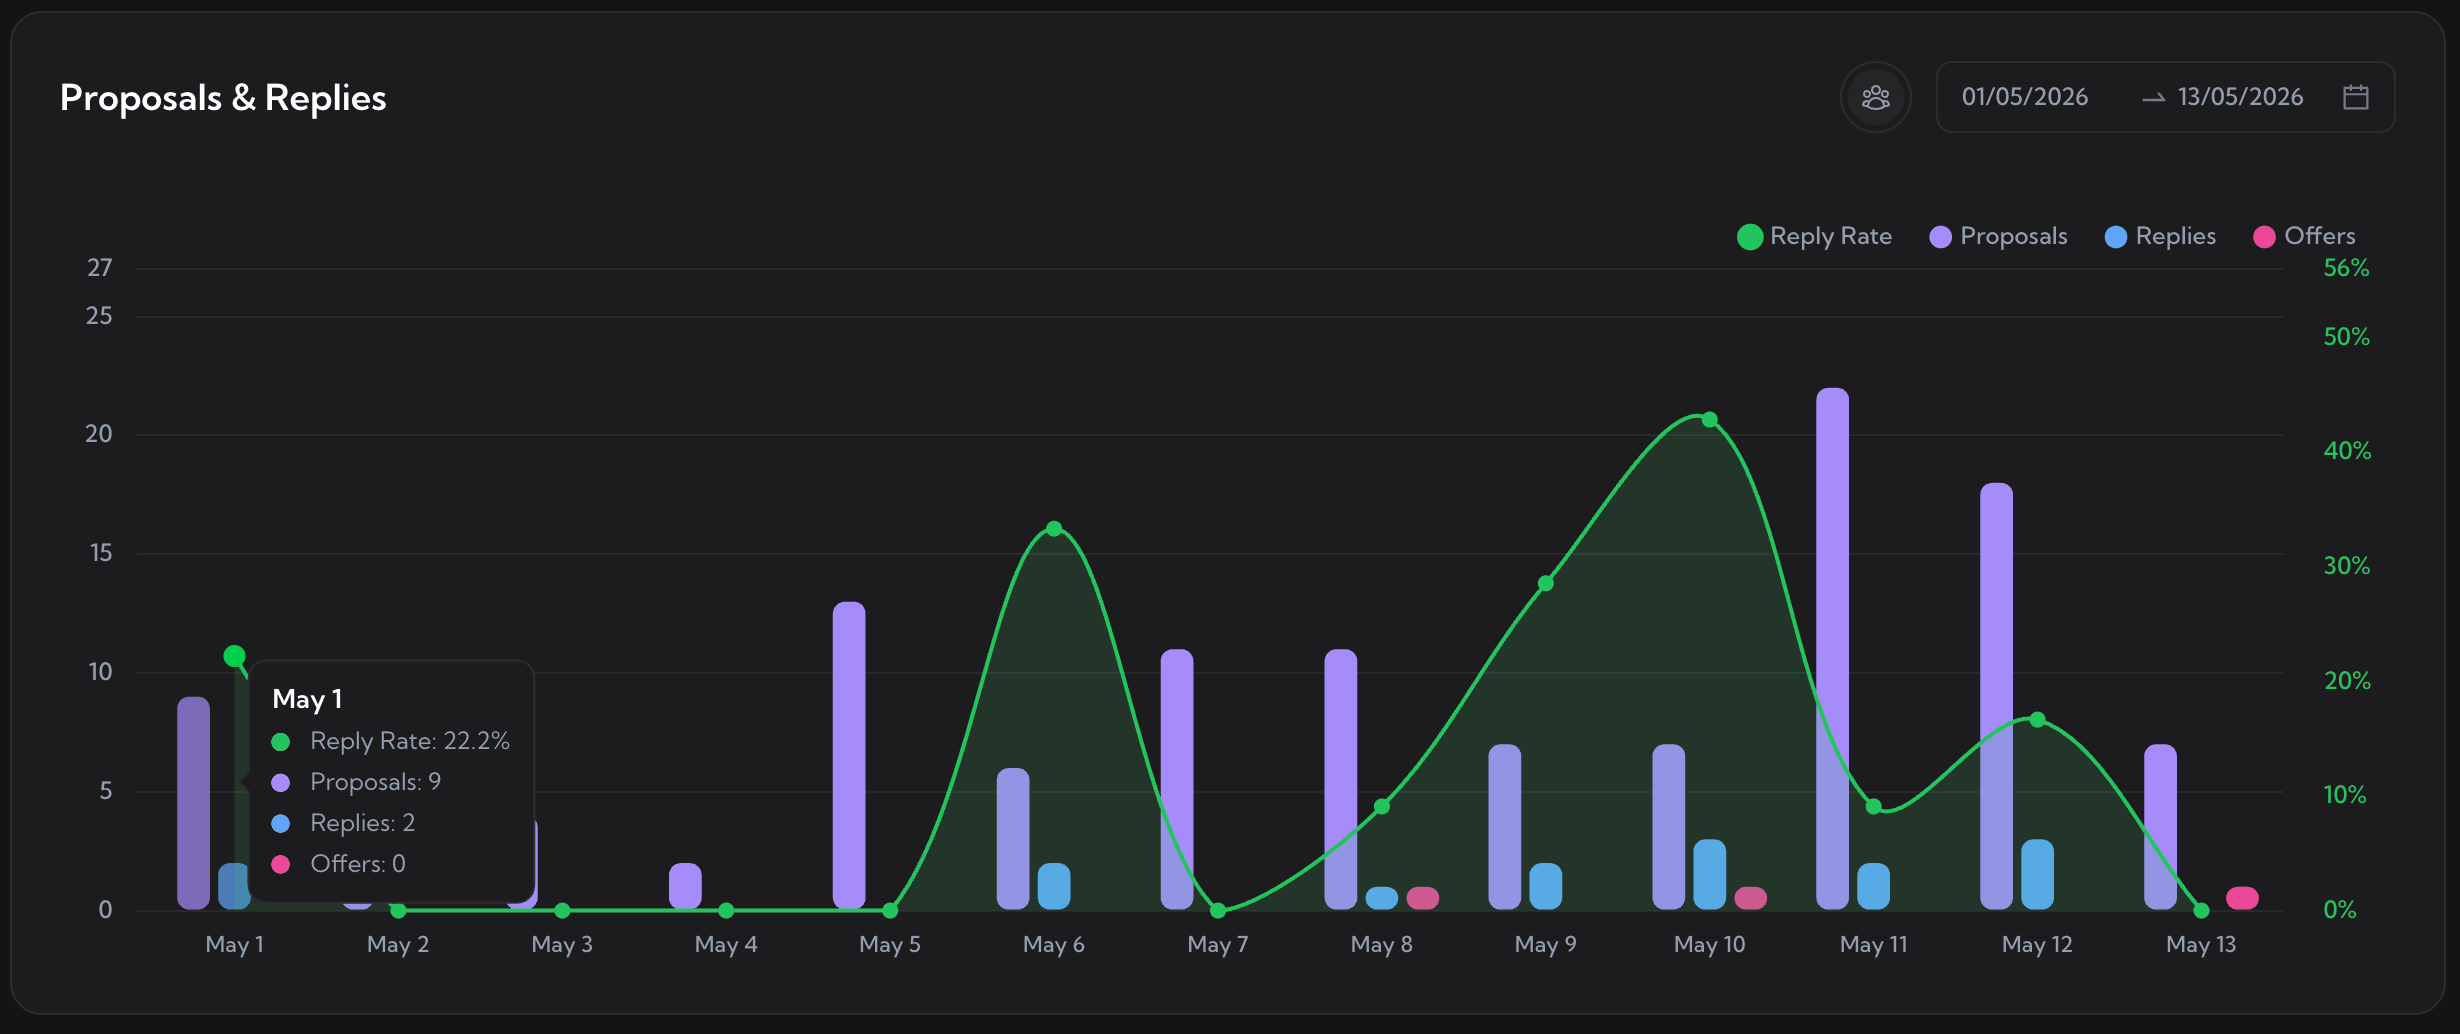
Proposals & Replies. Bars for proposals, replies, and offers; a reply-rate line on the second axis.

Trends & Insights

Three views into what is actually driving results.

One panel, three lenses. Switch tabs to read your pipeline from a different angle - where the funnel leaks, how much work comes to you, and what every reply costs in connects.

Upwex Trends and Insights - Conversion Funnel tab with orange Jobs Opened, purple Proposals, blue Replies and pink Offers bars and a green reply-rate line over a 13-day range

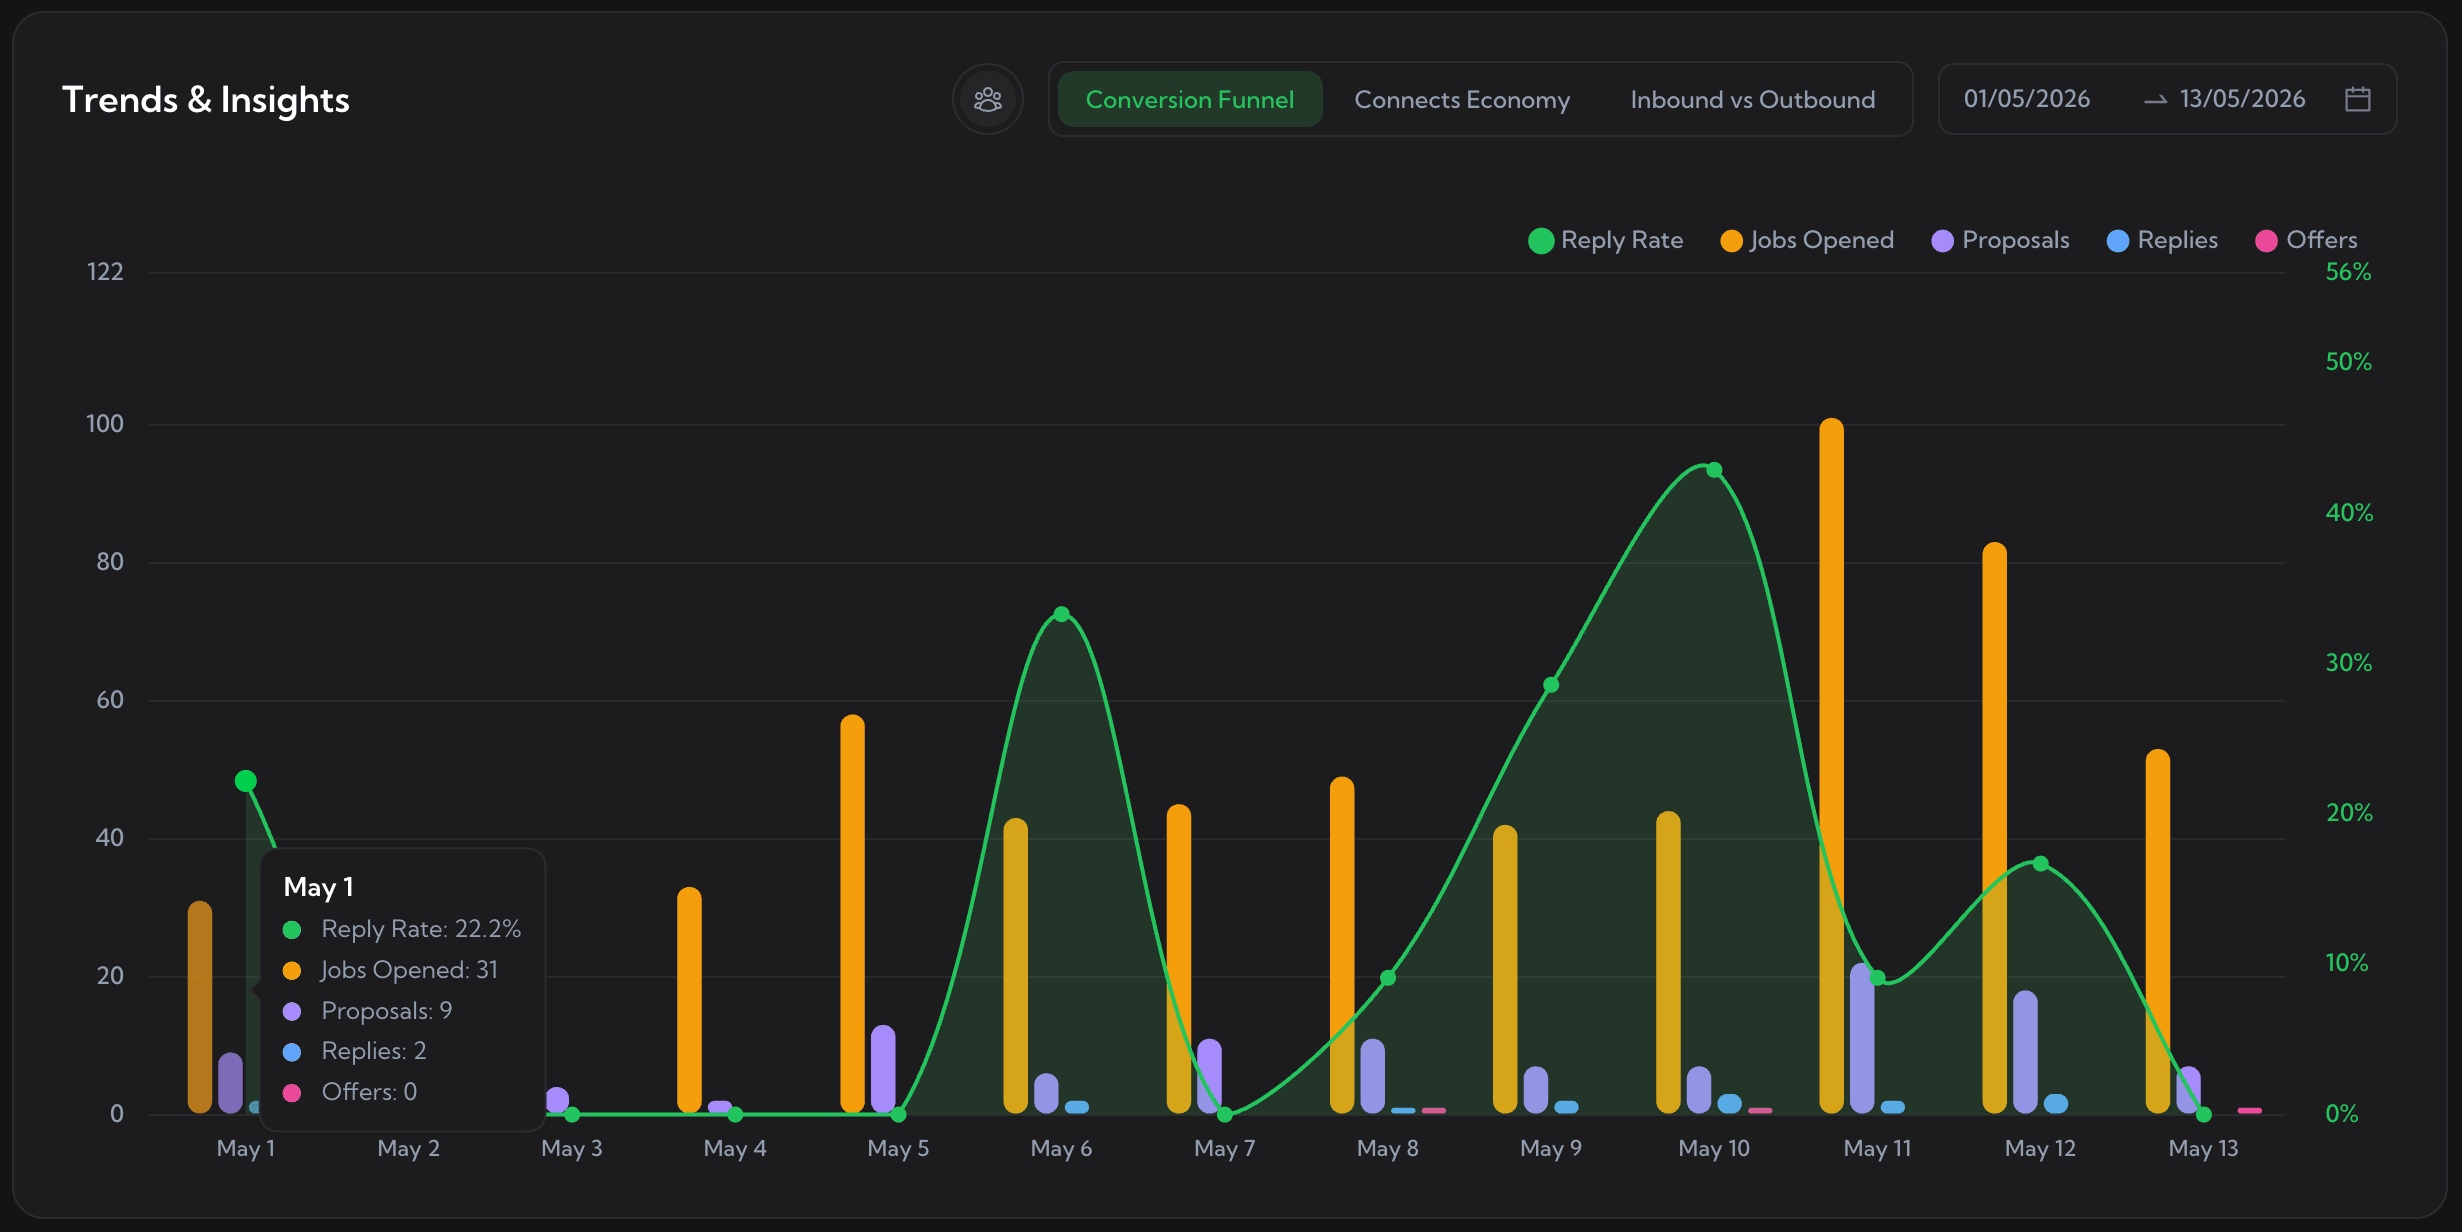
Conversion Funnel - jobs opened, proposals, replies, and offers with your reply-rate line, so you see where the funnel leaks.

Upwex Trends and Insights - Inbound vs Outbound tab with purple Proposals bars against green Invites, yellow Direct Messages and pink Offers

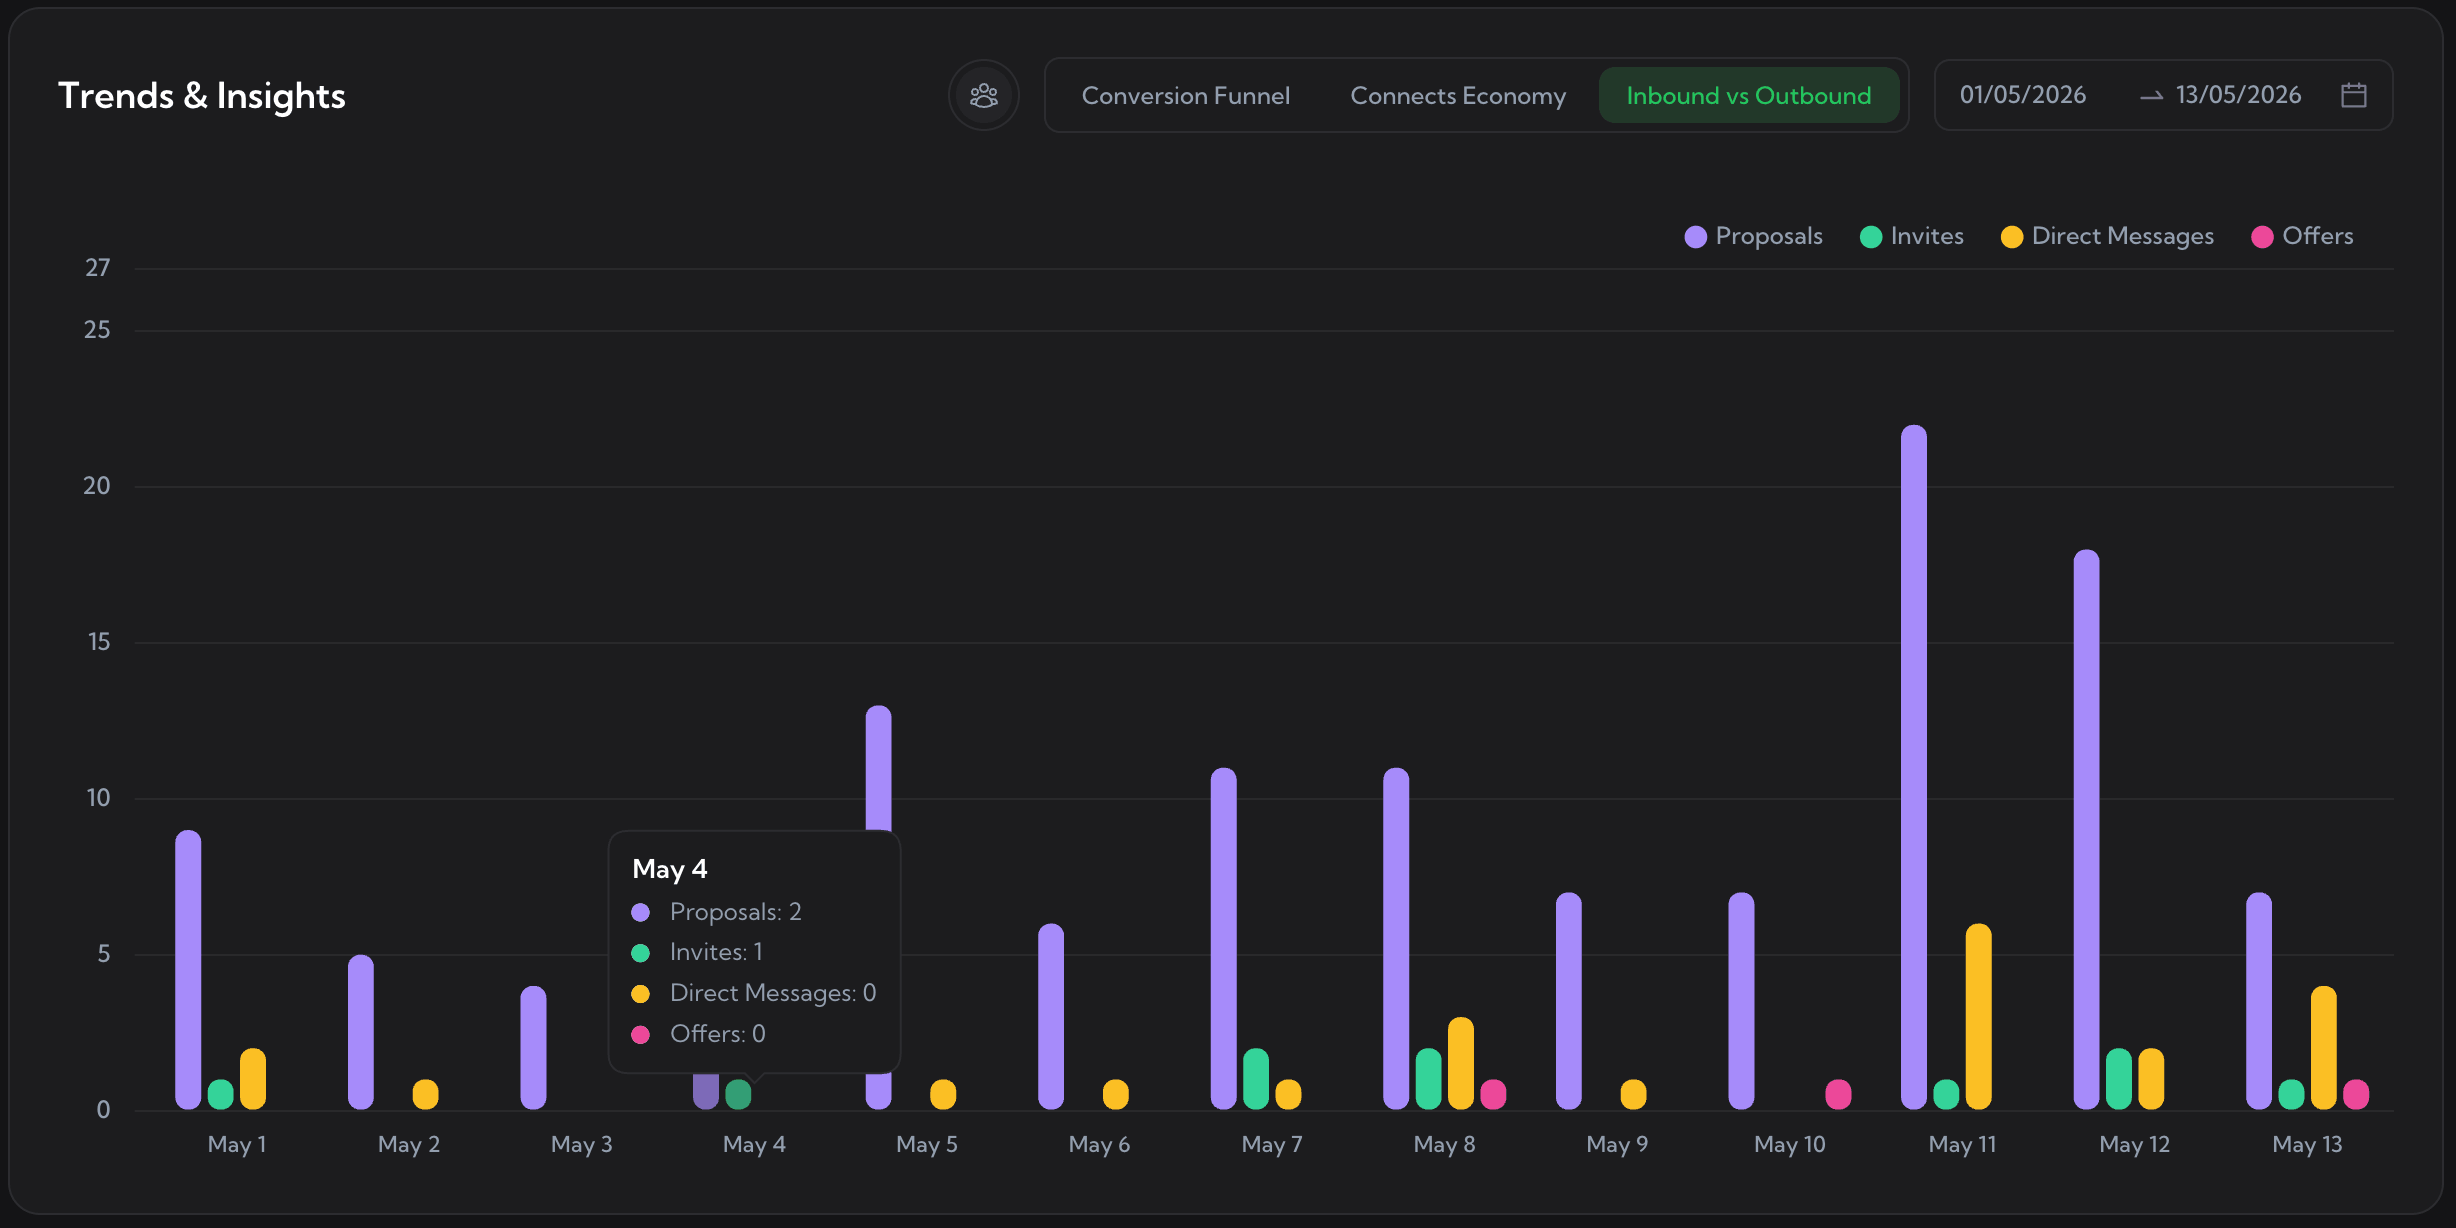
Inbound vs Outbound - proposals you sent against invites and direct messages you received, so you know how much work comes to you.

Upwex Trends and Insights - Connects Economy tab with orange Connects Used and purple Proposals bars and a blue connects-per-bid line

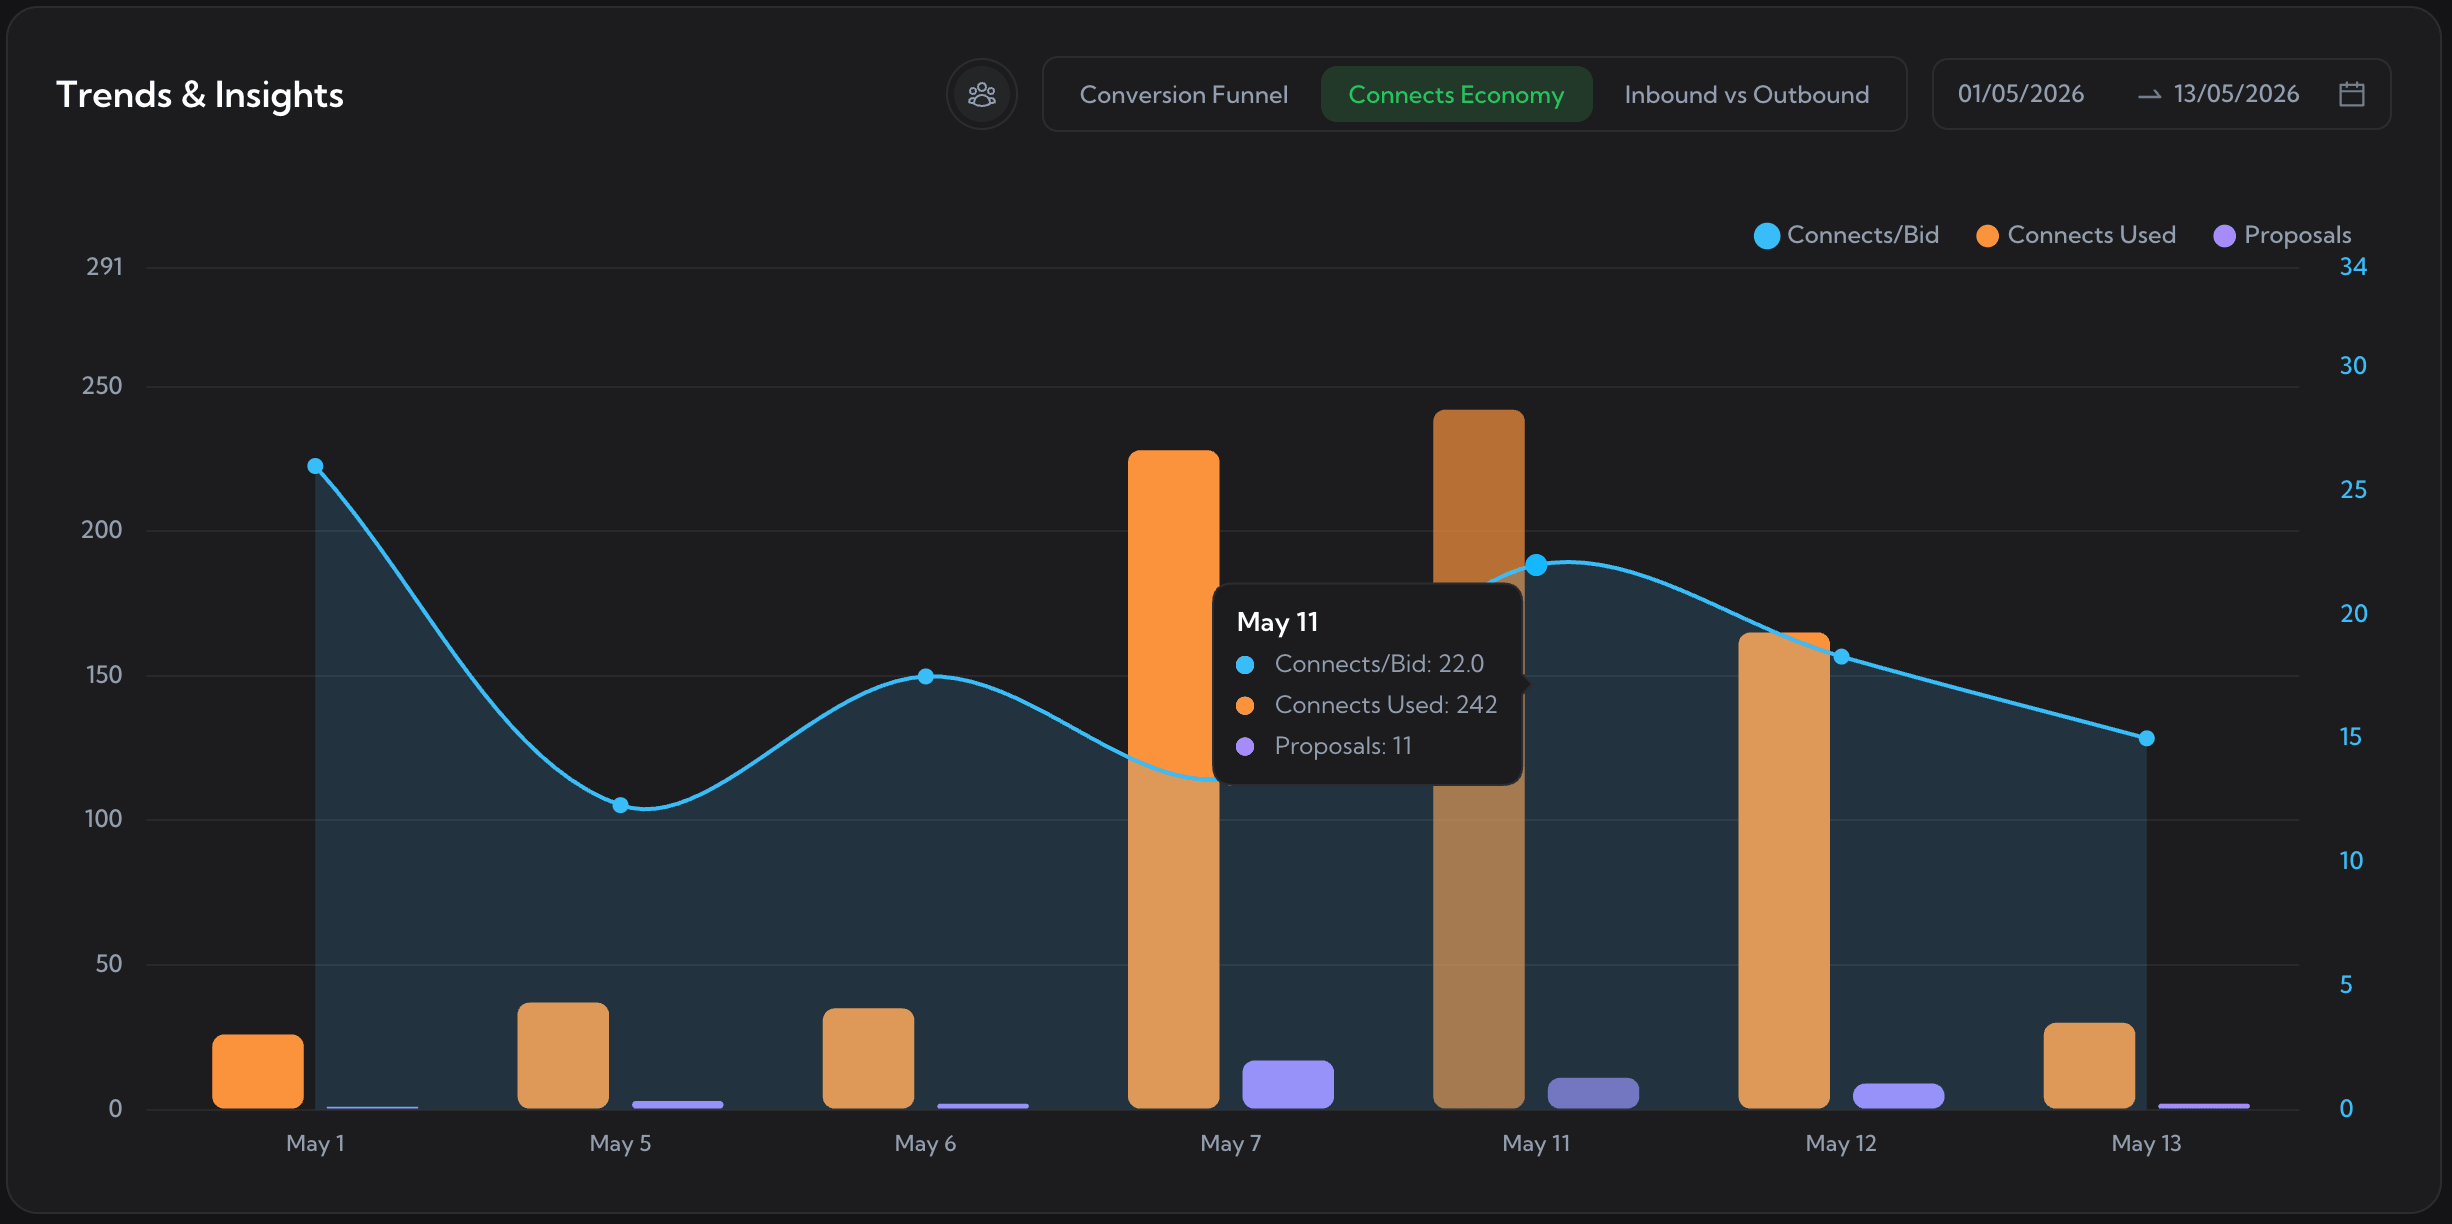
Connects Economy - connects used and connects per bid against proposals, so you see what each reply really costs.

Activity Heatmap

A year of Upwork activity, at a glance.

The heatmap turns your whole year into one grid, every day shaded by how active you were. Hover any day for the breakdown: activity score, proposals, jobs opened, DMs. Spot your streaks, your gaps, and the weeks you went quiet.

Upwex Activity Heatmap - a year-long grid of daily Upwork activity shaded from less to more, with a tooltip showing the May 5 breakdown of activity, proposals, jobs opened and DMs

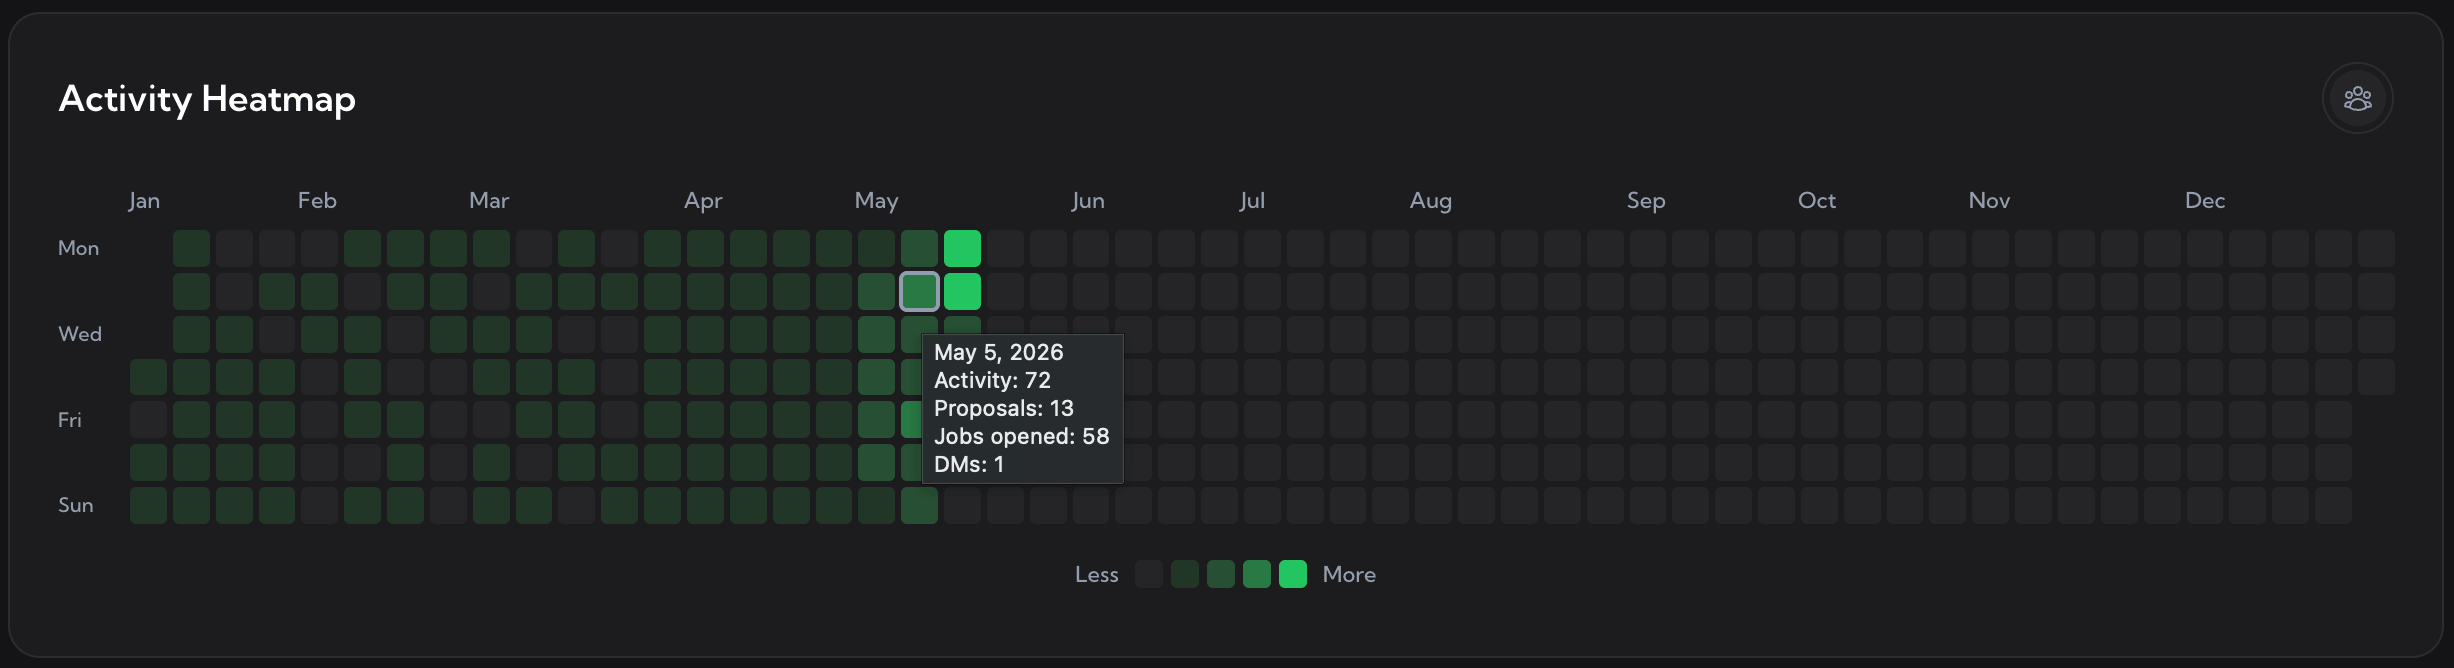
Activity Heatmap. A full calendar year of Upwork activity, with a per-day breakdown on hover.

Reports

A recap of your numbers, in your inbox.

You do not have to open the dashboard to stay on top of your pipeline. Upwex emails you a personalized recap - your jobs viewed, proposals, replies, reply rate, and connects - on a schedule. Same numbers as the dashboard, no logging in.

Weekly

A recap every Monday morning.

The weekly report covers the previous week and lands Monday morning: jobs viewed, proposals sent, replies, reply rate, and connects used, plus offers and DMs on the weeks you had them.

Monthly

A wider recap on the first Monday.

The monthly report covers the previous calendar month with the same metrics, so you can read the trend beyond a single week. Stop using Upwex and the reports stop on their own - no list to manage, nothing to unsubscribe from.

Pricing

Analytics is included on every plan.

Start free for 7 days. No card required. Cancel anytime.

Lite

$ 9.99 /month
Monthly billing only
  • Check Fit Job Analyzer (0-100 score)
  • AI Cover Letter + Screening Q&A
  • Cover Letter Templates with per-template reply rate
  • Full analytics dashboard + Activity Heatmap
  • Multi-profile + Weekly recap emails
  • Adaptive AI engine (auto-failover)
  • 100 AI Credits / seat / month

Max

$ 49 /month
  • Everything in the Pro plan
  • 500 AI Credits / seat / month
  • Auto-Bidding scanner (24/7, hands-free)
  • Custom Match Algorithm prompt
  • Custom Red Flags prompt
  • 15+ Auto-Bidding settings (caps, schedule, scan)
7-day free trial No credit card required Cancel anytime
FAQ

Common questions about Upwork analytics.

What is the Upwex analytics dashboard?
The Upwex analytics dashboard is the page in your Upwex web app that measures your Upwork performance. It pulls together five panels - Activity Summary, Performance by Profile, Proposals and Replies, Trends and Insights, and an Activity Heatmap - so every job viewed, proposal sent, reply, offer, and connect is tracked in one place.
What metrics does Upwex track?
Jobs viewed, proposals sent, replies, reply rate, offers, invites, direct messages, connects used, boost connects, average connects per bid, and cost per reply. Each one is shown for the period you pick, with a comparison against the previous period.
How is reply rate calculated?
Reply rate is replies divided by proposals sent, as a percentage, for the period you select. On the dashboard it is colour-coded: green above 10%, yellow between 5 and 10%, red below 5% - a quick read on whether your proposals are landing.
Can I see analytics per Upwork profile or team member?
Yes. The Performance by Profile panel breaks every metric down per Upwork profile and per team member - proposals, replies, reply rate, invites, DMs, offers, and connects, with a totals row. Most panels also have a member picker, so you can filter the whole view to one person.
What is the Connects Economy view?
Connects Economy is one of the three Trends and Insights tabs. It plots connects used and connects per bid against your proposals, so you can see what each bid - and each reply - actually costs you in connects, and whether that cost is trending up or down.
Does the dashboard include Auto-Bidding activity?
Yes. Auto-Bidding submissions roll into the same analytics as your manual bids: a proposal the bot sent counts in Proposals Sent, a job it scanned counts in Jobs Viewed, and reply rate is recalculated across both. Your numbers reflect everything, hands-on and hands-off.
What are the weekly and monthly reports?
Upwex emails you a personalized recap of your own numbers. The weekly report covers the previous week and arrives every Monday morning; the monthly report covers the previous calendar month and arrives on the first Monday. Both show jobs viewed, proposals, replies, reply rate, and connects. If you stop using Upwex, the reports stop on their own.
Where does the analytics data come from?
From your own activity. The Upwex Chrome extension records every job you view, proposal you send, reply and offer you receive, and connect you spend; the backend aggregates it per profile and period. The dashboard and the email reports read the same source, so the numbers always match.

Stop guessing. Start measuring your Upwork pipeline.

You cannot improve a reply rate you never see. Start a free trial, let Upwex track your activity, and watch the numbers tell you exactly what to fix.

No credit card required. Cancel anytime.